


Solar Open Access Installations in India Surge 160% YoY to 2.7 GW
Installations rise 55% QoQ as developers accelerate project execution
May 21, 2026


Follow Mercom India on WhatsApp for exclusive updates on clean energy news and insights
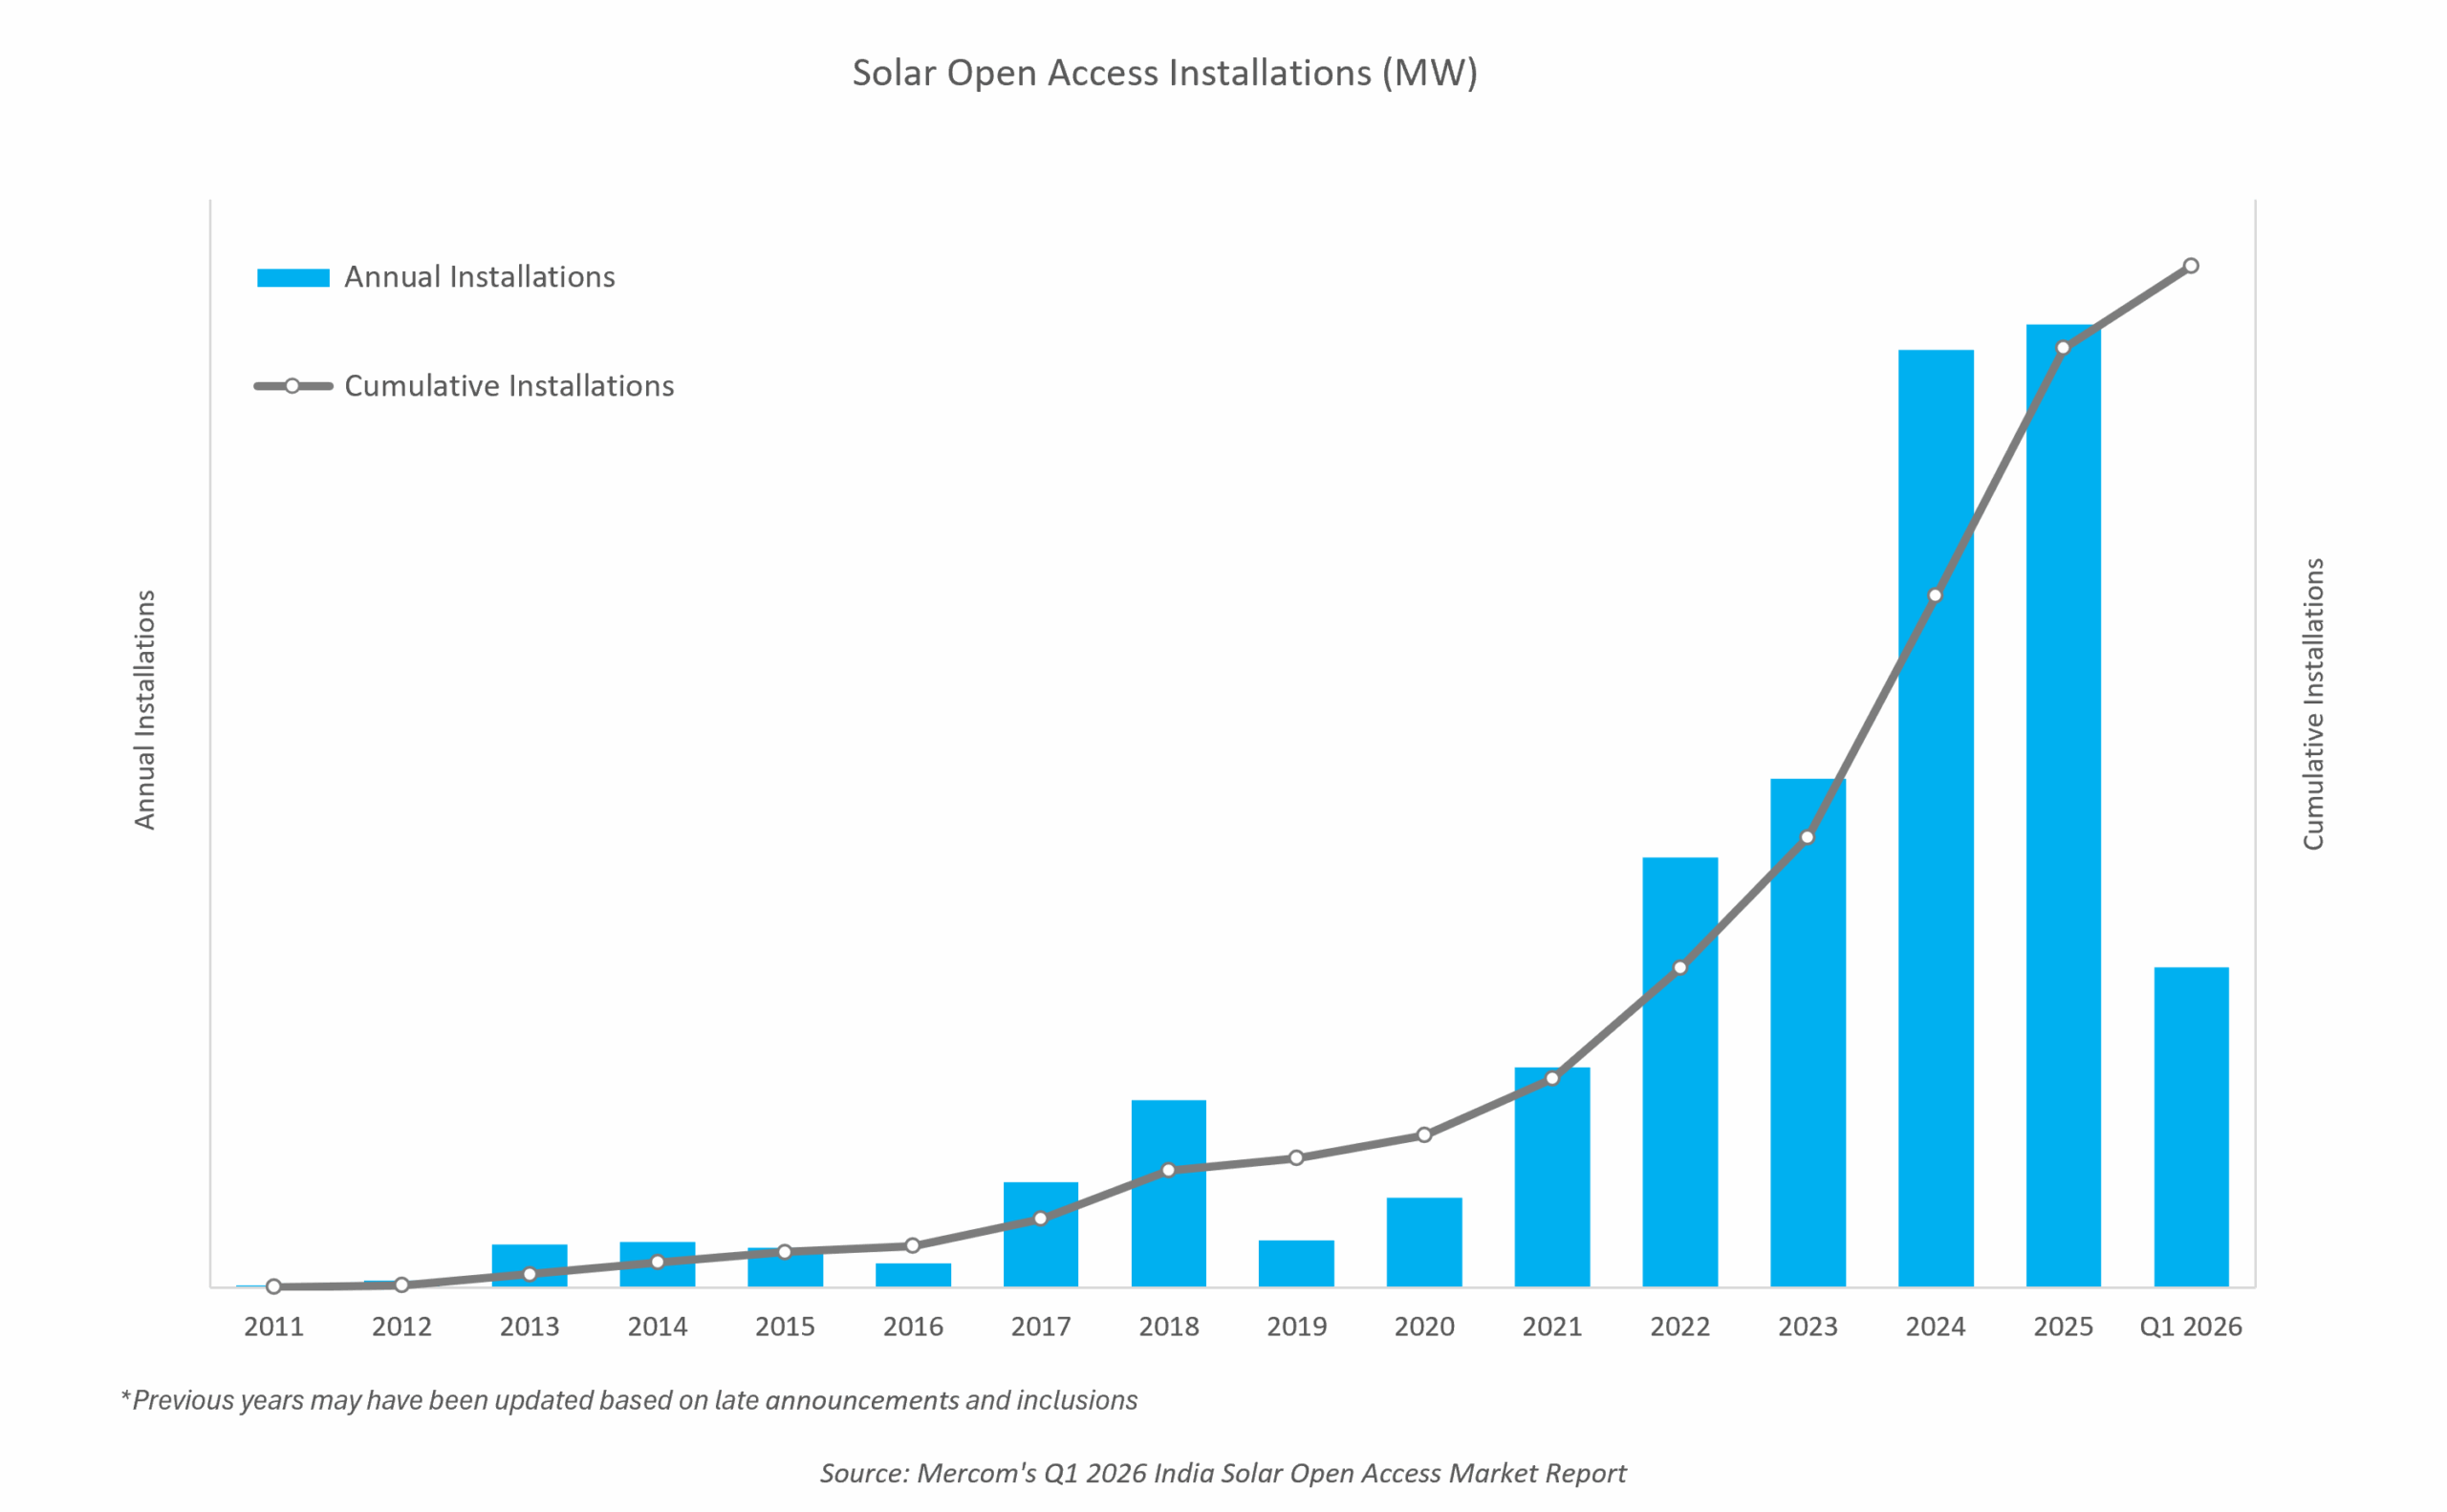
India added 2.7 GW of solar open access capacity in the first quarter (Q1) of 2026, according to Mercom India’s Q1 2026 India Solar Open Access Market Report, marking a 55% quarter-over-quarter increase from 1.7 GW and 160% year-over-year increase from 1 GW.
The growth was driven by a combination of regulatory push, anticipated supply-side concerns, supportive state-level policies, stronger market outreach, and improved project execution across key markets.
The implementation of the Approved List of Models and Manufacturers (ALMM) List-II for solar cells, effective from June 2026, emerged as one of the biggest factors behind the commissioning rush during the quarter.
Developers accelerated installations to complete projects before the new domestic cell sourcing norms take effect amid concerns over higher procurement costs and limited supplies.
Priya Sanjay, Managing Director at Mercom India, said, “Developers could not risk delays because if the projects have not been commissioned, they would have to forego the benefits of ISTS charges waiver and the ability to procure non-DCR panels.”
She added that once developers sign power purchase agreements with commercial and industrial consumers, pricing is largely locked in, leaving limited room to absorb higher equipment costs later.
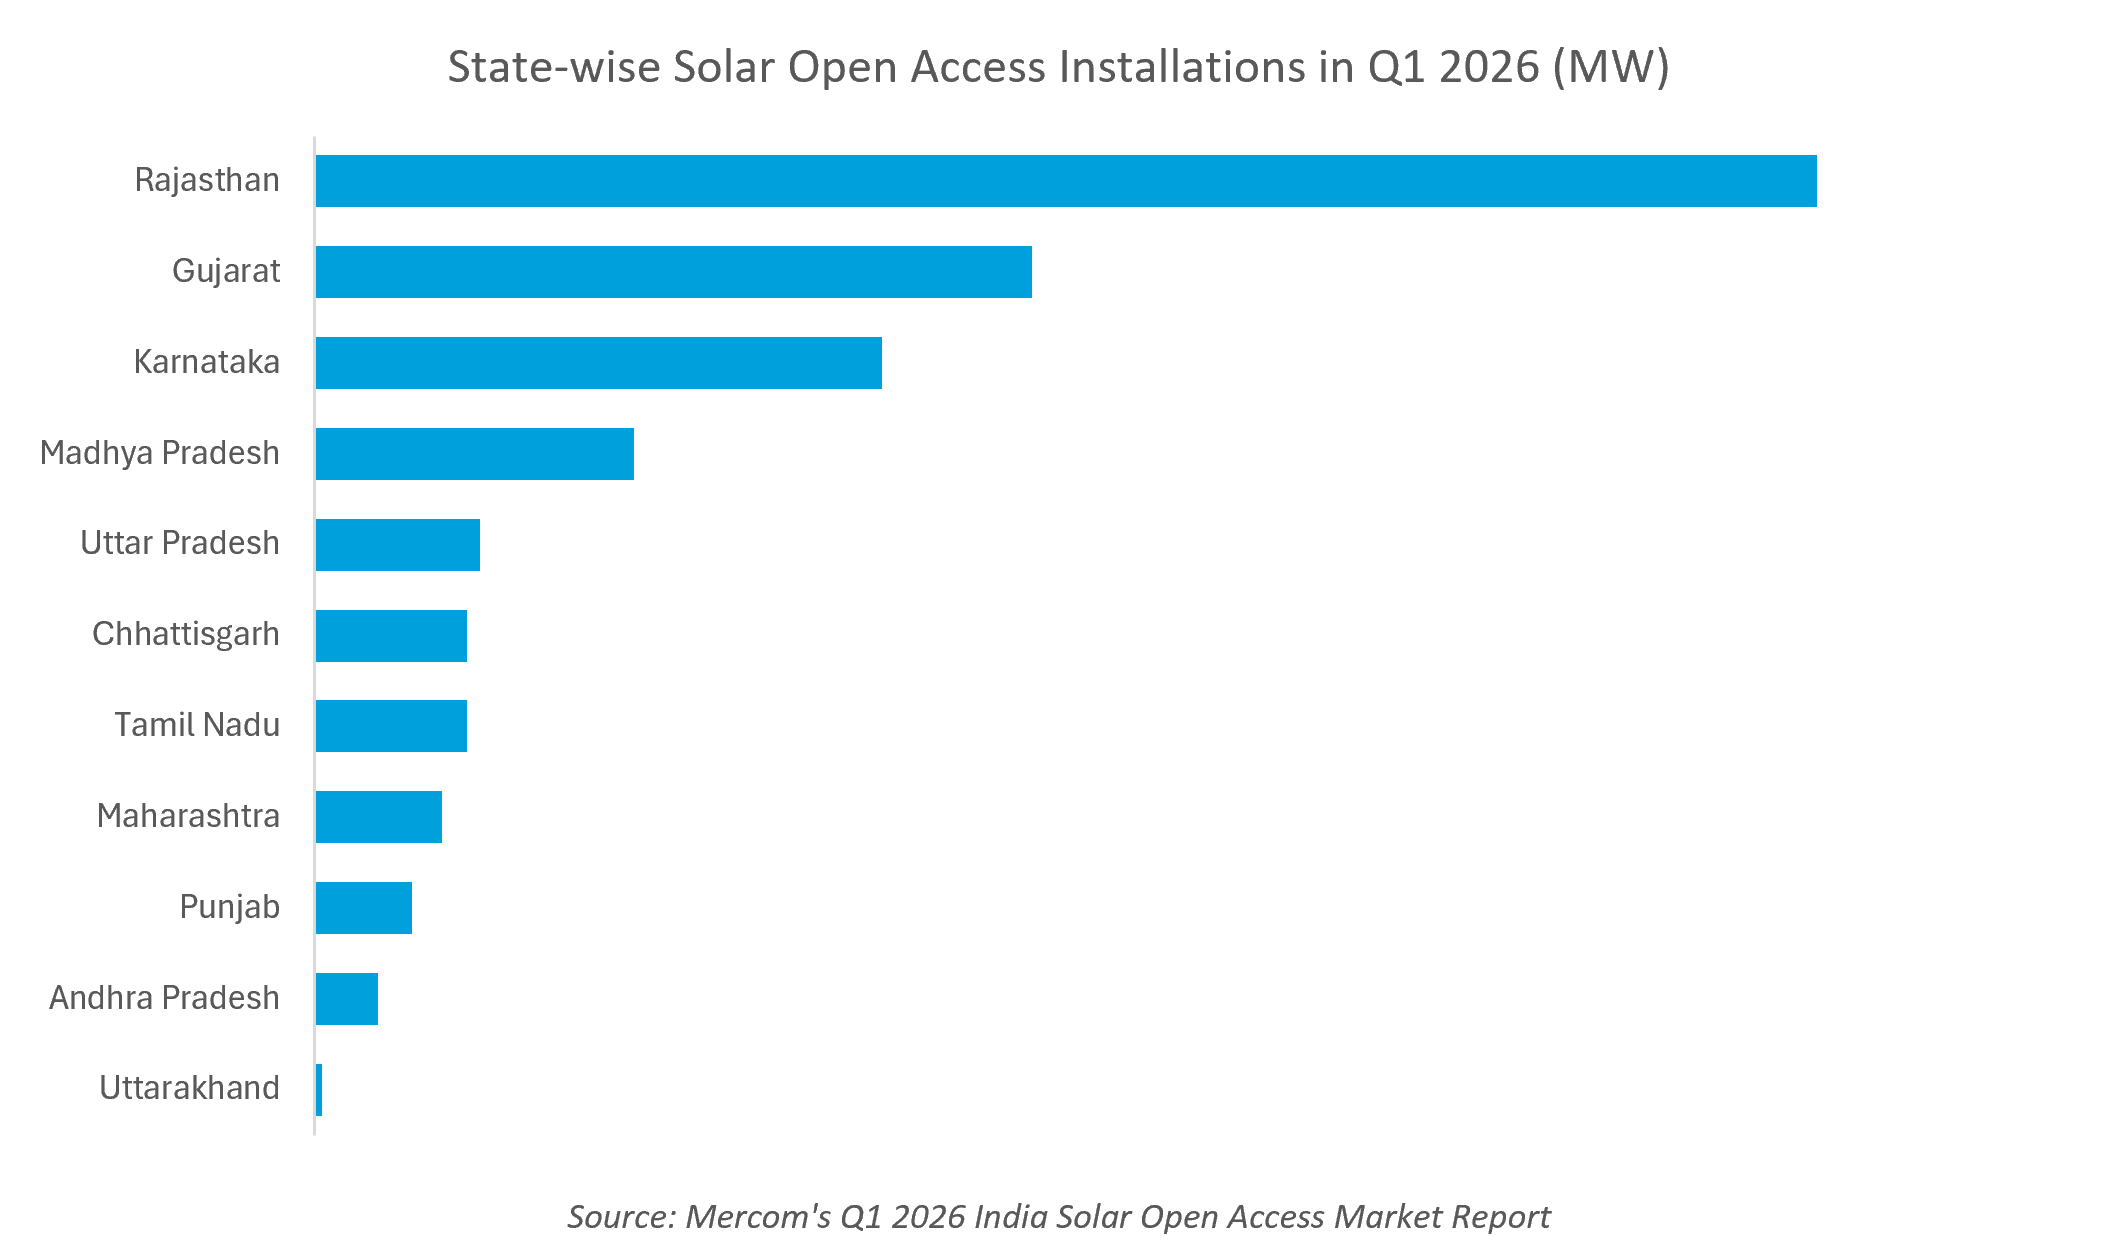
State-Wise Installations
Rajasthan accounted for nearly 39% of solar open-access capacity additions in Q1 2026, making it the leading state for the quarter. The top five states together contributed over 84% of total installations.
As of March 2026, cumulative installed open-access solar capacity in India stood at 32.9 GW.
Karnataka continued to lead cumulative installations, with an over 23% share of the country’s total solar open-access capacity. Maharashtra ranked second with around 16%, followed closely by Rajasthan with nearly 16%. The top five states accounted for almost 77% of cumulative installed capacity.
Explaining the concentration of projects in these states, Sanjay mentioned that the regulatory environment, solar irradiation and land availability were key factors. In some states, solar irradiation may be strong, but regulatory challenges and land acquisition constraints limit open access growth.
Market Trends
The top five states accounted for over 86% of the announced installations.
However, developers could continue to face supply chain uncertainty and lack of regulatory clarity over the next few quarters.
Sanjay said some developers may delay procurement decisions while waiting for possible extensions to the ALMM deadline. She noted that during transition periods, suppliers often raise prices due to anticipated shortages, which can affect project economics and commissioning timelines.
The report also tracks activity in India’s renewable power exchanges. In Q4 2025, Adani Green Energy was the leading seller in the Green Day-Ahead Market (G-DAM), accounting for 34% of electricity sold.
The cleared volume of Renewable Energy Certificates traded on the Indian Energy Exchange increased 285% quarter-over-quarter, reflecting higher participation from obligated entities procuring renewable attributes through the exchange mechanism. In contrast, trade volume in the Green Term-Ahead Market (G-TAM) declined around 40% quarter-over-quarter.
Odisha emerged as the leading procurer from G-DAM, followed by Damodar Valley Corporation and Gujarat.
Demand from commercial and industrial consumers is expected to remain strong over the coming quarters, despite regulatory and supply-side uncertainties. Sanjay said the market’s focus has shifted beyond immediate tariff savings toward long-term electricity price stability through multi-year power purchase agreements.
“The demand is always going to be there,” she said, adding that corporations increasingly value fixed electricity costs over 10 to 25 years, even if immediate savings compared to grid tariffs have narrowed.
The Q1 2026 Solar Open Access Market Report by Mercom India is 92 pages long and covers vital information and data on the market. For the complete report, visit: https://www.mercomindia.com/product/q1-2026-mercom-india-solar-open-access-market-report


Meghana Prasad
More articles from Meghana Prasad.
