


Solar Meets 25% of EU Power Demand in June, Capacity Up 34 GW in 1H 2026
Annual installations are expected to decline 2.1% to 68.1 GW in 2026
September 10, 2026

Follow Mercom India on WhatsApp for exclusive updates on clean energy news and insights
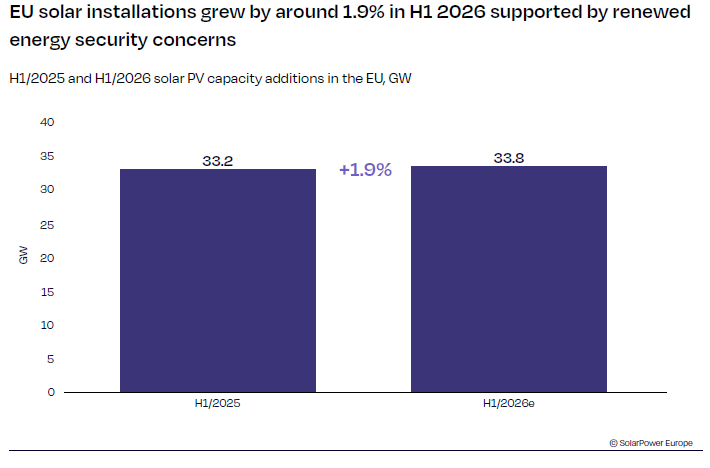
The European Union (EU) added at least 33.8 GW of solar photovoltaic (PV) capacity in the first half (1H) of 2026, up 1.9% from 33.2 GW during the same period last year, according to SolarPower Europe’s EU Solar Market Update.
Growth was stronger than previously anticipated but did not signal a recovery in underlying market fundamentals. Higher fossil fuel prices and renewed energy security concerns from the Middle East conflict supported solar demand in several member states, despite weakening support programs and ongoing regulatory and grid constraints.
The EU had approximately 445 GW of operational solar capacity at the end of June 2026.
Between March 1 and August 31, solar generated 282 TWh of electricity, avoiding an estimated €30 billion (~$35.1 billion) in gas import costs that would otherwise have been required for gas-fired power generation. The avoided costs averaged €164 million (~$192 million) per day, or more than €1 billion (~$1.17 billion) per week.
Solar supplied more than 20% of EU electricity in May, June, and July. Its share reached a record 25% in June, making it the EU’s largest source of electricity generation during the month. Fourteen EU countries generated at least 30% of their electricity from solar during at least one month in 2026, while Latvia, Luxembourg, Estonia, and Lithuania exceeded 50%.
Despite the improved near-term outlook, SolarPower Europe maintained that current market and policy conditions are insufficient to sustain the deployment needed to meet the EU’s 750 GW solar target by 2030.
SolarPower Europe expects the EU to add 68.1 GW of solar capacity in 2026 in its medium scenario, a 2.1% decline from the revised record of 69.6 GW installed in 2025.
The latest estimate is 6.6 GW higher than its December 2025 forecast of 61.5 GW. The association’s low and high scenarios project additions of 62 GW and 74.1 GW, respectively.
The report said the stronger outlook reflects resilient installations in the first half and additional market drivers rather than an improvement in policy and regulatory conditions.
Utility-Scale Solar Leads
Utility-scale solar is expected to remain the EU’s largest market segment in 2026, accounting for 56% of new capacity, up marginally from 55% in 2025. Rooftop solar’s share is expected to decline from 45% to 44%.
Residential installations have weakened across several markets as demand following the previous energy crisis normalized, and incentives became less favorable.
The commercial and industrial (C&I) segment appears more resilient than the residential segment, although growth has slowed compared with previous years and developments differ significantly between markets. Businesses continued to invest in solar to lower energy costs, hedge against future price volatility and support electrification. France demonstrated the segment’s growing importance, while Germany moved in the opposite direction, with C&I installations declining in both quarters of H1 2026.
However, utility-scale projects are also facing mounting challenges. Negative electricity prices, declining solar capture rates, curtailment, grid connection constraints, and inadequate storage and flexibility are pressuring project revenues and power purchase agreement markets.
Leading Markets
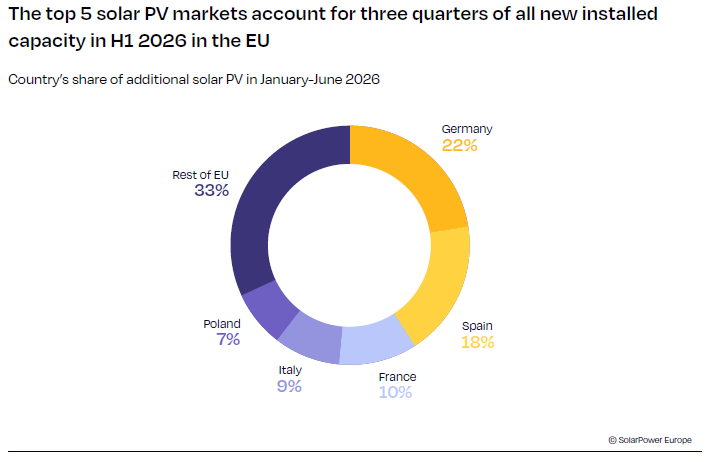
Germany remained Europe’s largest solar market, installing approximately 7.5 GW in 1H 2026, marginally lower than 7.8 GW a year earlier. Utility-scale installations increased, while residential and commercial and industrial rooftop additions remained below the previous year’s levels.
Spain installed approximately 5.9 GW, down 6% from 6.3 GW in 1H 2025. Curtailment increased sharply, with nearly 400 hours recorded during the first quarter, while declining solar capture rates and administrative barriers continued to affect investment decisions.
France added 3.5 GW, compared with 3.3 GW a year earlier. Italy’s installations rose to 3.1 GW from 2.8 GW, driven by larger systems. Poland recorded the strongest growth among the five largest markets, with additions rising nearly 40% to almost 2.5 GW from 1.8 GW.
Germany, Spain, France, Italy, and Poland accounted for about 75% of the EU’s new solar capacity in the first half of the year.
Romania installed about 1.8 GW, up from 1.5 GW, while Greece added around 1.5 GW, nearly matching its installations for all of 2025. Finland commissioned 478 MW across eight utility-scale projects, and Latvia added approximately 600 MW.
Curtailment and Storage
The increasing penetration of solar is also creating grid integration challenges across Europe.
Poland curtailed 1.17 TWh of wind and solar generation in 1H 2026, up 45% YoY. In June alone, 247 GWh of potential solar generation was curtailed, equivalent to more than 14% of potential utility-scale solar output.
SolarPower Europe expects the EU battery energy storage market to add 52 GWh in 2026, up approximately 44% from 36 GWh in 2025. Greater storage deployment is helping shift solar generation from midday to evening hours while providing grid flexibility services.
The report said insufficient storage, grids, and demand-side flexibility are contributing to growing differences between midday and evening electricity prices. During a late-June heatwave, evening peak prices exceeded €1,000 (~$1,170)/MWh in Belgium and reached €747 (~$874)/MWh in Germany.
According to another report by SolarPower Europe, Europe installed 36 GWh of battery energy storage system capacity in 2025, marking the 12th consecutive year of record annual additions.


Rakesh Ranjan
More articles from Rakesh Ranjan.