


Global Renewable Capacity to Reach 4,600 GW by 2030, Driven Mostly by Solar: IEA
IEA’s World Energy Outlook 2025 warns of deepening energy and climate risks
November 17, 2025


Follow Mercom India on WhatsApp for exclusive updates on clean energy news and insights
The World Energy Outlook 2025, published by the International Energy Agency (IEA), has thrown light on how new vulnerabilities in electricity systems and mineral supply chains now complement traditional risks associated with oil and gas. Conflicts, trade restrictions, and instability coexist with oversupplied oil markets and subdued prices.
The IEA notes that progress on emissions reduction has slowed even as the climate crisis deepens. The year 2024 was the hottest on record and the first in which global temperatures exceeded 1.5 degrees Celsius above pre-industrial levels.
Governments are responding in different ways. Some are relying on renewables and efficiency to achieve security and affordability, while others focus on ensuring access to traditional fuels. Although fractures in the global trade system persist, energy trade continues to expand as producers of oil, solar panels, batteries, and liquefied natural gas seek out global markets.
The report presents several scenarios to show how policies and technologies could shape the energy system. The Current Policies Scenario reflects only those measures already in force and offers a conservative view of technological change.
The Stated Policies Scenario encompasses both enacted and officially announced measures, facilitating the more rapid adoption of technology.
The Net Zero Emissions by 2050 Scenario charts a pathway to eliminate global energy-related carbon dioxide emissions by mid-century.
Critical Minerals and Supply Chain Pressures
The report highlights that energy security is no longer just about oil and gas. Serious threats are emerging in the supply of critical minerals. One country dominates the refining of 19 out of 20 strategic minerals used in energy systems, holding an average market share of around 70%. As of late 2025, over half of these minerals are subject to some form of export control. These materials are essential for batteries, power grids, electric vehicles, and also for technologies such as artificial intelligence chips and jet engines.
Since 2020, the bulk of new refining capacity has come from the existing major producers, further concentrating supply. The IEA finds that reversing this trend will be slow without determined policy action. Left to market forces, supply will continue to favour incumbent producers with lower costs, leaving the global energy system exposed to disruption.
Renewable Deployment Surges, but Grids Lag
Renewables met more than 70% of global electricity demand growth in 2024, with wind and solar alone adding nearly 700 TWh of new generation. Solar capacity additions exceeded 540 GW, roughly ten times the level seen in 2015.
However, the expansion of renewable generation stands in stark contrast to slower growth in grid infrastructure. Investment in grids has risen only gradually to about $400 billion annually, while investment in renewable generation has soared to over $1 trillion.
As a result, approximately 1,700 GW of renewable projects at advanced stages of development are stalled due to unavailable grid connections.
The imbalance is also visible in spending ratios: a decade ago, for every dollar invested in power generation, 60 cents went into grids compared to today, where that figure is closer to 40 cents.
Without major upgrades to transmission and distribution networks and investments in storage, demand response, and grid flexibility, the pace of renewable deployment could slow sharply, especially in markets with weaker infrastructure.
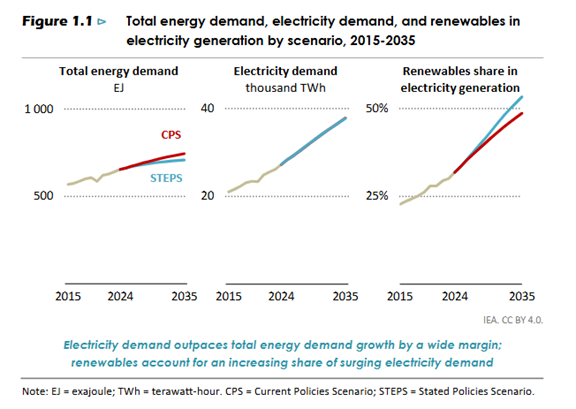
The report, however, indicates that renewables continue to expand faster than any other energy source. Even under the slower Current Policies Scenario, renewables account for the largest share of demand growth through 2035, with solar photovoltaic capacity additions remaining near today’s record levels of 540 GW annually. In the Stated Policies Scenario, renewables continue to experience strong growth worldwide, despite a slower expansion in the United States.
Installed renewable energy worldwide is expected to increase by 4,600 GW by 2030. The growth is being driven primarily by solar installations, which will account for nearly 80% of the increase in renewable capacity over the next five years.
China remains the largest market, accounting for between 45% and 60% of new renewable deployment over the next decade. Global manufacturing capacity for solar modules in 2024 was sufficient to produce more than twice as many panels as were installed and nearly three times as many battery cells. An ample supply has kept prices competitive but raised questions about dependence on Chinese production.
Renewable energy is also set to achieve a historic milestone by overtaking coal-fired generation either in 2025 or by 2026 at the latest.
India’s Expanding Role in Global Energy
Between 2000 and 2010, advanced economies accounted for half the growth in the global car fleet. Between 2010 and 2020, China alone achieved the same. Between now and 2035, half of the global car fleet growth is expected to come from emerging and developing economies outside China, led by India and Southeast Asia.
By 2035, 80% of global energy consumption growth is expected to occur in regions with high solar potential, a marked contrast to the previous decade when cooler regions dominated. India’s growing demand and investment in renewables position it at the center of the global energy transformation. The country’s progress in renewable energy deployment and electricity access will significantly influence global coal demand and emissions outcomes.
Nuclear power is experiencing a revival. More than forty countries now include it in their national energy strategies, and over 70 GW of new capacity is under construction, one of the highest levels in thirty years. Global nuclear capacity is expected to increase by at least one-third by 2035, supported by both traditional large reactors and emerging small modular reactor designs.
Surplus Capacity
Rapid investment in clean energy manufacturing over the past five years has created a significant glut in global production. In 2024, the world had double the necessary solar module manufacturing capacity and three times the battery cell capacity needed for actual output. Much of this surplus is concentrated in China, which has built the world’s largest renewable supply chain.
A considerable portion of the solar and battery output is even flowing into inventories, highlighting a growing mismatch between the pace of manufacturing and the readiness of markets and grids to absorb new capacity.
The surplus has triggered sharp price declines, eroding profit margins for manufacturers worldwide while intensifying competition. These pressures are expected to shape trade policy, investment decisions, and deployment patterns over the next decade.
Exports
China’s clean energy exports have quadrupled since 2019 and now account for around 5% of total Chinese goods exports. Two-thirds of this export value in early 2025 went to advanced economies, and one-third to emerging markets and developing economies (EMDEs).
The real-world impact is substantial. Chinese solar exports to Pakistan since 2023 could generate the equivalent of one-third of Pakistan’s electricity demand, and solar capacity in the country may now exceed conventional power capacity. Low-cost Chinese EVs are also gaining market share across several emerging economies, sometimes overtaking adoption rates in advanced markets.
Yet China’s dominance has raised concerns. Many countries have responded with new trade barriers targeting solar modules, batteries, and EVs. At the same time, Chinese firms have pledged $30 billion in overseas investments in clean energy manufacturing to diversify supply and sidestep restrictions.
Emissions and Climate Trajectories
Global energy-related carbon dioxide emissions reached a record 38 gigatons in 2024. Under the Current Policies Scenario, they remain near this level, while in the Stated Policies Scenario, they fall below 30 gigatons by mid-century. These paths correspond to roughly 3 degrees Celsius of temperature increase in the Current Policies case and 2.5 degrees in the Stated Policies case.
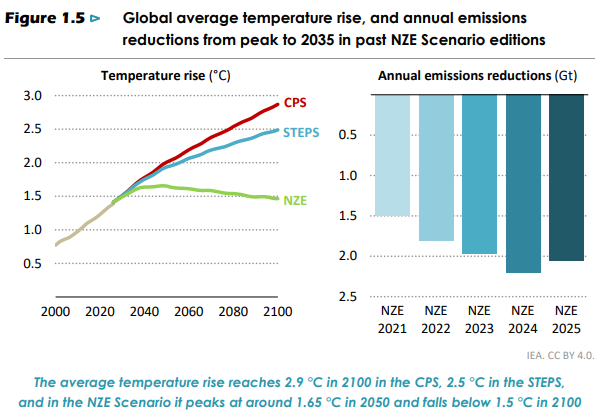
The Net Zero Scenario still predicts a temporary overshoot of the 1.5-degree target, with temperatures remaining above it for several decades before returning to below by 2100. Achieving this would require large-scale use of carbon dioxide removal technologies that have yet to be proven at full scale.
The report finds that new national climate pledges submitted in 2025 would cut emissions by between 11% and 25% by 2035, consistent with outcomes in the Stated Policies Scenario. The IEA warns that a decisive push is still needed to meet global efficiency and renewable targets.


Arjun Joshi
More articles from Arjun Joshi.
