US Solar Industry Grows by 19% YoY with 23.6 GW Installed in 2021
The industry is expected to more than triple from 120 GW to 464 GW by 2032
March 14, 2022
Follow Mercom India on WhatsApp for exclusive updates on clean energy news and insights
According to the latest U.S. Solar Market Insight report, released by the Solar Energy Industries Association (SEIA) and Wood Mackenzie, the U.S. solar sector has installed a record 23.6 GW of solar capacity in 2021; a 19% year-over-year (YoY) increase compared to last year.
Solar accounted for 46% of all new electricity-generating capacity in the U.S. in 2021. This represents the third consecutive year that solar has had the largest share of new generating capacity.
Texas, California, and Florida were the top three states for annual solar capacity additions for the third straight year with 6 GW, 3.6GW, and 1.6 GW, respectively. Virginia, Georgia, and Indiana were the other states with over 1 GW of solar installed in 2021.
According to the report, the U.S. solar industry is expected to more than triple from 120 GW installed today to 464 GW by 2032.

Utility-scale solar
Utility-scale solar set an annual installation record at nearly 17 GW. Despite this record growth, final installations in 2021 were lower than expected due to supply chain constraints, logistics challenges, and trade headwinds. For the 2022 pipeline, developers have postponed at least 8% of planned capacity to 2023 or later and canceled at least 5%.
However, these challenges are unlikely to outweigh the demand for the utility-scale solar segment in the long run. The report suggests that ongoing efforts to expand federal clean energy support, increasing interest in environmental, social, and governance (ESG) investments, and new procurement strategies will allow industry recovery in 2023.
Residential solar
Residential solar installations set a new annual record with a total of 4.2 GW in 2021 and more than 500,000 projects installed in a year for the first time. Residential solar installations grew 30% YoY, the highest annual growth rate since 2015.
Despite elevated component pricing and supply chain issues worsening throughout the year, the industry achieved this installation. Many industry players continued to experience tight module and battery availability during the last quarter of 2021 and into 2022.
Community solar
Community solar volumes reached 957 MW, representing 7% YoY growth. Total community solar capacity is expected to double over the next five years, with considerable upside if new state programs are created and current programs are expanded.
Commercial solar
Commercial solar volumes in 2021 were nearly equal to those in 2020 at 1,435 MW. Project delays from interconnection challenges and supply chain constraints limited the growth. Double-digit growth in commercial solar volumes is expected for the next two years with project spillovers from 2021 to 2022, demand pull-in from the current ITC schedule, and numerous state-level policy programs.
Policy Challenges
The new 10-year forecasts from Wood Mackenzie show that passing a long-term extension of the solar ITC, new manufacturing tax credits, and other clean energy incentives would increase solar installations by 66% over the next decade compared to baseline projections. In addition, if the manufacturing tax credits move forward, the industry could unlock nearly 20 GW of new domestic solar manufacturing capacity.
Under an ITC extension scenario, 10-year forecasts for the residential, non-residential, and utility-scale solar sectors would increase by 20%, 15%, and 86%, respectively. Solar capacity additions by 2030 would exceed 70 GW annually under this scenario.
The stalling of the legislation is the apparent hurdle that the industry sees that keeps them from achieving the scale it is set out to, the report says.
Without policy action in Congress, Wood Mackenzie projects that U.S. solar capacity would only reach 39% of what’s needed to hit President Joe Biden’s climate goal to make the U.S. power grid run on 100% clean energy by 2035.
Solar PV system costs
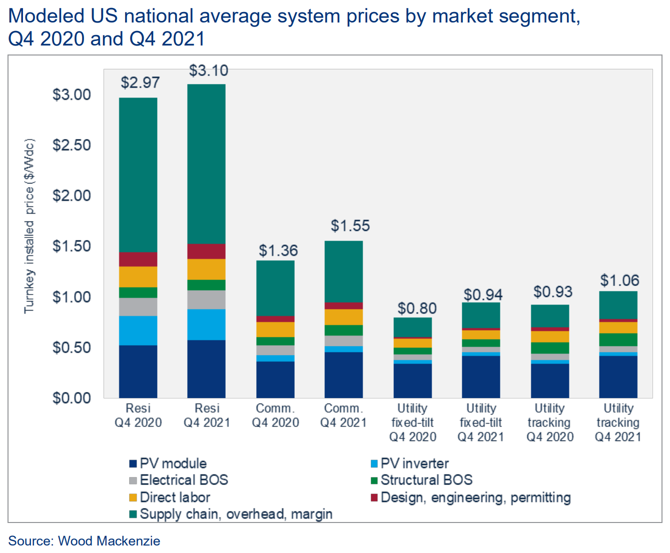
In Q4 2021, system prices increased YoY across all market segments. System pricing increased quarter-over-quarter by 1.1% and 4.4% for residential and commercial solar, respectively.
System prices fell 0.3% for utility fixed-tilt and were flat for utility single-axis tracking. Average system prices continue to increase due to rising equipment costs, raw material input, freight costs, and labor shortages.

Prices for commercial and utility fixed-tilt projects continue to increase as manufacturers pass the cost of increased raw materials to the end-user.
The growth of the utility single-axis tracker market has led to increased adoption of bifacial modules and large format modules, which helps to partially offset other price increases through system efficiencies.
“In the face of global supply uncertainty, we must ramp up clean energy production and eliminate our reliance on hostile nations for our energy needs,” said Abigail Ross Hopper, CEO, and President of SEIA.
Last month, the Biden administration extended the Section 201 solar tariffs imposed on imported crystalline silicon photovoltaic (CSPV) modules for four more years, with several modifications. The decision includes exemption of bifacial solar panels from the duty extension and increases the allowable import quota for solar cells from 2.5 GW to 5 GW.
