


Solar Corporate Funding Jumps 56% YoY to $16.9 Billion in 1H 2026
Venture capital funding totaled $1.5 billion across 35 deals in 1H 2026
July 31, 2026


Follow Mercom India on WhatsApp for exclusive updates on clean energy news and insights
Global solar companies raised $16.9 billion in corporate funding during the first half (1H) of 2026, a 56% year-over-year (YoY) increase from $10.8 billion in the corresponding period of 2025, according to Mercom Capital Group’s 1H and Q2 2026 Solar Funding and M&A Report. The number of corporate funding deals increased by 23%, from 78 in 1H 2025 to 96 in 1H 2026.
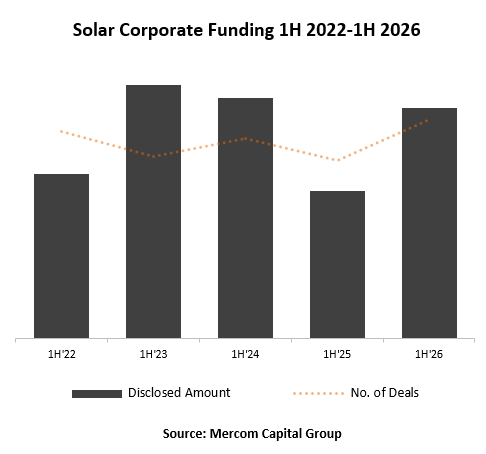
According to Raj Prabhu, CEO at Mercom Capital Group, stronger funding activity reflected improving market sentiment and growing investor confidence driven by rising electricity demand, particularly from data centers and artificial intelligence applications in the U.S. Investors continue to view solar as the fastest way to add generation capacity, while the July 4, 2026, deadline for projects to qualify for incentives further accelerated financing activity, particularly for project development and acquisitions.
Global venture capital (VC) funding declined 40% YoY to $1.5 billion in 1H 2026 from $2.5 billion. Despite the decline in funding value, the number of deals increased 9% YoY to 35 from 32. During the second quarter (Q2) of 2026, VC funding fell 60% YoY to $445 million, while the number of deals remained at 18.
Solar downstream companies recorded the highest venture capital activity, raising $884 million across 22 deals in 1H 2026. Inox Clean Energy secured the largest funding round at $343 million, followed by Nexamp ($180 million), Clean Max Enviro Energy Solutions ($165 million), Amarenco ($150 million), and GREW Solar ($118 million). A total of 135 investors participated in solar VC funding during the period.
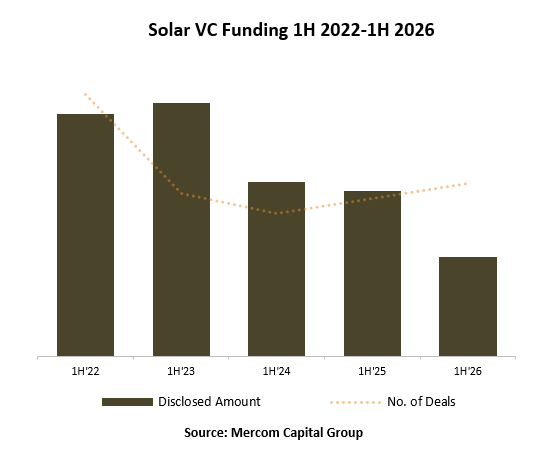 Prabhu said venture funding declined in value despite higher deal activity as investors favored smaller funding rounds and remained selective in deploying capital. Investment continued to flow primarily toward downstream businesses, reflecting a preference for lower-risk, nearer-term opportunities over capital-intensive upstream investments.
Public market financing increased 371% YoY to $2.2 billion across 17 deals in 1H 2026 from $467 million across five deals during the same period last year.
According to Prabhu, higher stock prices of certain public companies and improved valuations enabled companies to raise equity on more favorable terms.
Debt financing reached $13.2 billion across 44 deals, a 69% YoY increase from $7.8 billion across 41 deals in 1H 2025.
Prabhu said debt has continued to dominate solar financing despite elevated interest rates over the past two years as the cheapest way to raise capital.
Securitization activity declined 66% YoY to $540 million across three deals compared to $1.6 billion raised through four deals in the first half of 2025.
Solar corporate merger and acquisition (M&A) activity strengthened during the period, increasing to 57 transactions in 1H 2026 from 50 transactions in the corresponding period of 2025. The largest transaction was INOX Solar Americas’ agreement to acquire Boviet Solar Technology’s U.S. subsidiary for approximately $750 million.
Solar project acquisitions also increased during the first half of the year. A total of 134 project acquisitions totaling 25.2 GW were recorded, compared to 106 acquisitions totaling 19.9 GW in 1H 2025. The number of transactions increased 26% YoY, while acquired capacity grew 27% YoY.
“Corporate and project M&A activity remained strong in recent years despite elevated interest rates and policy uncertainty. The July 4 incentive qualification deadline prompted buyers to acquire development-stage projects, accelerating transaction activity across early-stage assets along with later-stage projects,” Prabhu added.
He expects M&A activity to remain steady through the second half of 2026.
Project developers and independent power producers were the most active acquirers during Q2 2026, purchasing 4.4 GW of projects. Investment firms followed with 2.2 GW. Other buyers, including energy suppliers, engineering and construction companies, acquired 180 MW. Utilities acquired two projects totaling 54 MW.
The 70-page report covers 347 companies and investors and includes 64 charts, graphs, and tables.
To learn more about Mercom’s 1H and Q2 2026 Solar Funding and M&A Report, visit: https://mercomcapital.com/product/1h-and-q2-2026-solar-funding-and-ma-report/


Parth Shukla
More articles from Parth Shukla.