


India Adds Record 8.4 GW of Solar Open Access Capacity in 9M 2026
Installations declined 33% quarter-over-quarter to 2.3 GW in Q3 2026
November 18, 2026

Follow Mercom India on WhatsApp for exclusive updates on clean energy news and insights
India added a record 8.4 GW of solar open access capacity in the first nine months (9M) of calendar year (CY) 2026, up 29% year-over-year (YoY), according to Mercom India’s newly released Q3 and 9M 2026 India Solar Open Access Market Report.
The growth was driven by the increasing adoption of captive ownership models and long-term power purchase agreements (PPAs). The temporary exemption from the Approved List of Models and Manufacturers (ALMM) List-II requirements for eligible projects also improved access to lower-cost modules, strengthening project economics.
“The primary driver of growth has been the increasing number of consumers recognizing the financial and business value of solar open access agreements. Many companies have sustainability initiatives and green energy commitments, along with related obligations, that encourage them to procure renewable energy. Open access has also been a significant contributor to the development of large-scale solar projects. However, I believe the market could have grown much faster without the policy uncertainties we have witnessed this year,” said Priya Sanjay, Managing Director at Mercom India.
In the third quarter (Q3) of 2026, India added 2.3 GW of solar open access capacity, down 33% quarter-over-quarter (QoQ) from 3.4 GW in Q2 2026 and 8% YoY from 2.5 GW in Q3 2025.
The slowdown in quarterly installations can be attributed to grid connectivity constraints, approval delays, and frequent alterations to open access charges. Uncertainty surrounding electricity banking provisions also affected expected consumer savings and investment decisions, while evolving procurement and compliance requirements added to project development challenges.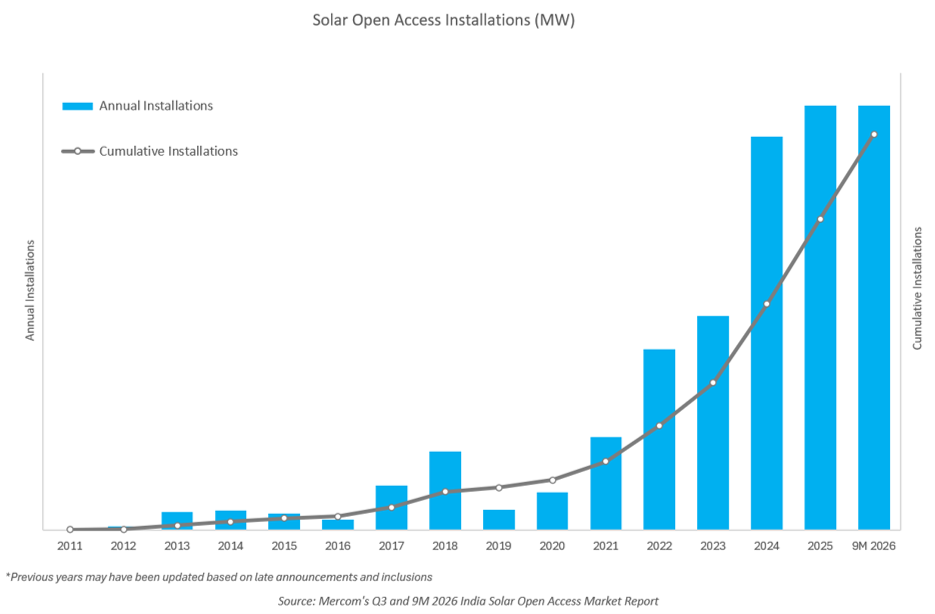
“The uncertainty surrounding ALMM, particularly its applicability, eligibility requirements, deadlines, and potential extensions, affected project decisions. The government announced an extension very close to the deadline, by which time several investment and project execution decisions had already been delayed. Although the industry anticipated an extension, the government had repeatedly indicated that it would not be granted. This uncertainty affected both commercial rooftop solar and open access projects,” Sanjay said.
State-wise Installations
States were more flexible in their approach and continued to streamline approvals and amend policies to address curtailment and support more flexible energy supply.
Rajasthan led solar open access capacity additions in Q3 2026, accounting for 29% of total installations during the quarter. Tamil Nadu and Gujarat ranked second and third, respectively.
Chhattisgarh and Maharashtra completed the top five states, which together accounted for 83% of the country’s quarterly solar open access capacity additions.
On the impact of banking regulations in Maharashtra, Sanjay said changes in banking provisions can significantly alter project economics, requiring developers to reassess and remodel projects.
“Maharashtra is a particularly important example. It has a substantial industrial base and relatively high electricity tariffs, making solar open access an attractive option for commercial and industrial consumers. However, changes in banking regulations have forced developers and consumers to reconsider their investment decisions,” she said.
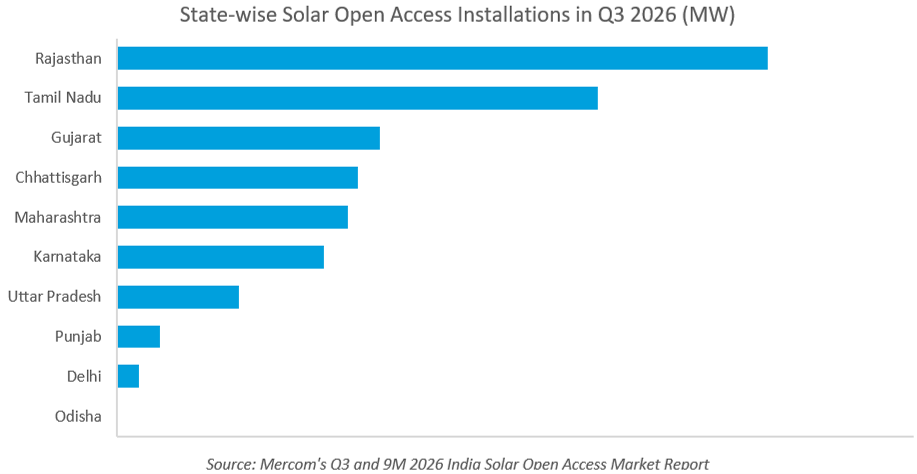
Other states that added solar open access capacity during the quarter included Karnataka, Uttar Pradesh, Punjab, Delhi, and Odisha.
Cumulative Installations
India’s cumulative installed solar open access capacity reached 39.3 GW as of September 2026.
Karnataka remained the leading state in cumulative solar open access installations, followed by Rajasthan and Maharashtra.
Together, these three states accounted for 52% of India’s cumulative installed solar open access capacity, reflecting the concentration of installations in states with great industrial demand and mature open access markets.
Standalone solar projects dominated the cumulative portfolio, followed by solar-plus-wind projects, solar-plus-battery storage projects, and solar-plus-wind projects with battery storage.
Demand is expected to remain strong as commercial and industrial (C&I) consumers seek to reduce electricity costs and meet corporate renewable energy targets.
Captive and group captive arrangements are likely to remain key procurement models. Supportive government policies, growing investments in data centers, and increased participation in the Term Ahead Market (TAM), Day Ahead Market (DAM), Green Term Ahead Market (G-TAM), and Green Day Ahead Market (G-DAM) could open new opportunities for open access developers.
However, going forward, Sanjay said, policy clarity would be critical to sustaining growth in the solar open access market, but improvements in supply chains, particularly the availability of ALMM-compliant solar cells and modules, would be equally important.
She expressed concerns about whether sufficient domestic solar cell manufacturing capacity would become operational in time to meet market demand. “Although additional capacity is expected, significant additions may not materialize until June 2027, or potentially August or September, depending on manufacturers’ commissioning schedules. Any delays could create further supply constraints and affect project execution.”
REC and Green Power Trading
Renewable Energy Certificate (REC) trading on the Indian Energy Exchange (IEX) recovered in Q3 2026 after declining in the preceding quarter.
REC trading volumes increased 56% QoQ to exceed 1.5 million certificates during the quarter.
Trading activity in the Green Term Ahead Market (G-TAM) also strengthened during the quarter.
Electricity trading volumes increased from 43.8 million units (MU) in July to 55.4 MU in August and 67.7 MU in September 2026.
September recorded the quarter’s highest weighted average price at ₹6.95 (~$0.073)/kWh.
Mercom India’s Q3 and 9M 2026 India Solar Open Access Market Report provides a detailed analysis of the solar open access market across 17 states, covering quarterly and cumulative installations, retail electricity tariffs, PPA prices, open access charges, and net landed costs.
The report also examines banking regulations, short-term power transactions, regulatory developments, and perspectives from leading solar open access developers across the country.
The Q3 and 9M 2026 India Solar Open Access Market Report by Mercom India covers vital market information and data.
For the complete report, visit: https://www.mercomindia.com/product/q3-2026-mercom-india-solar-open-access-market-report


Rakesh Ranjan
More articles from Rakesh Ranjan.