


Global Corporate Funding for Solar Surges 131% YoY to $11.1 Billion in Q1 2026
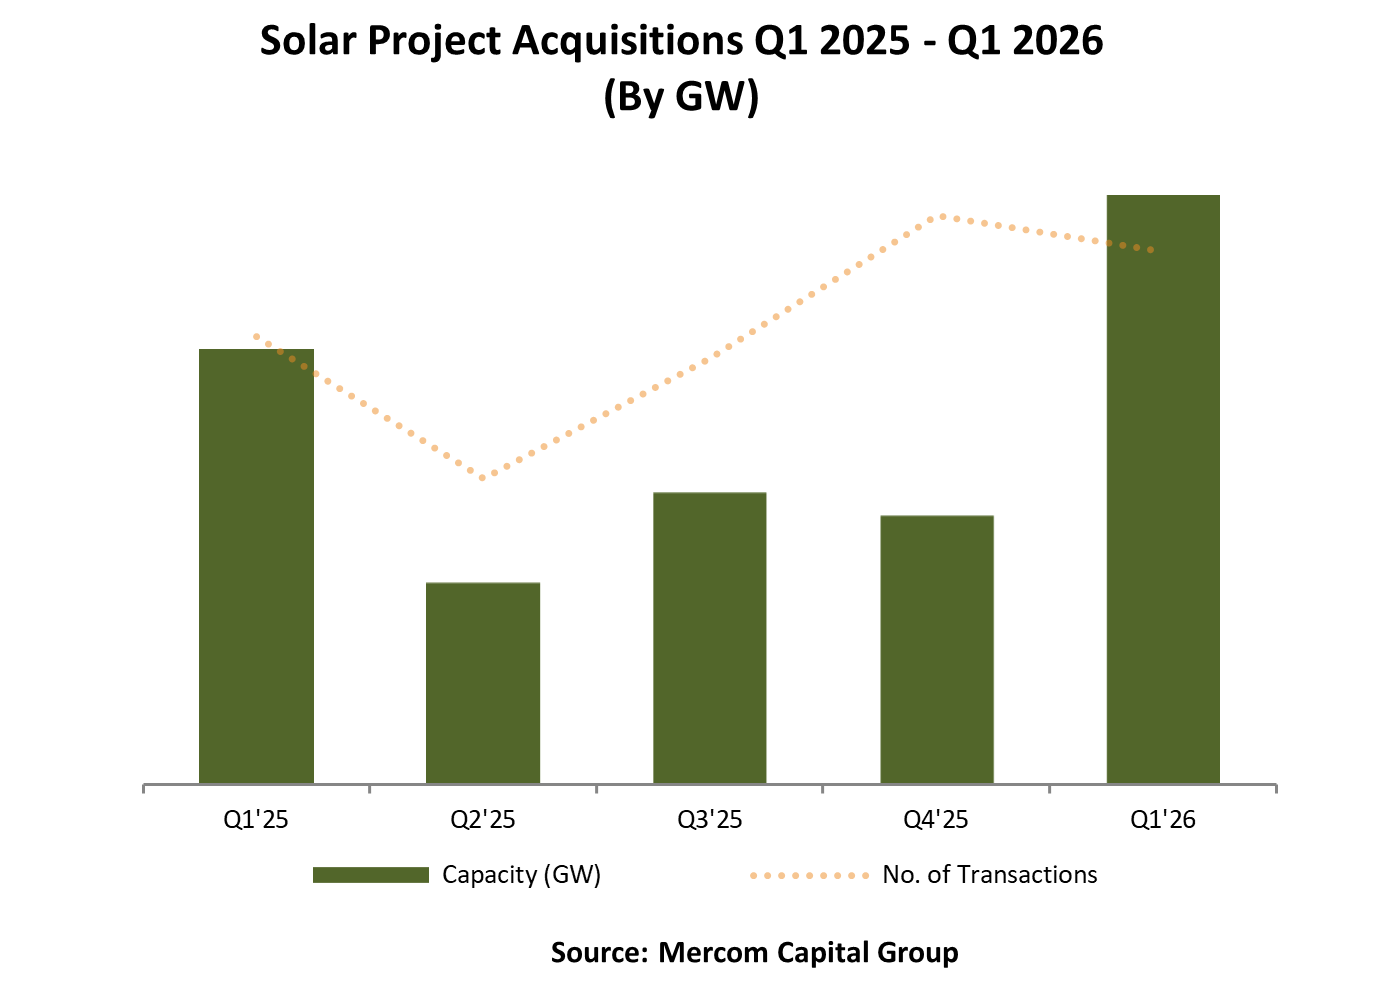
Solar project M&A reaches 18.4 GW in the quarter
May 8, 2026


Follow Mercom India on WhatsApp for exclusive updates on clean energy news and insights
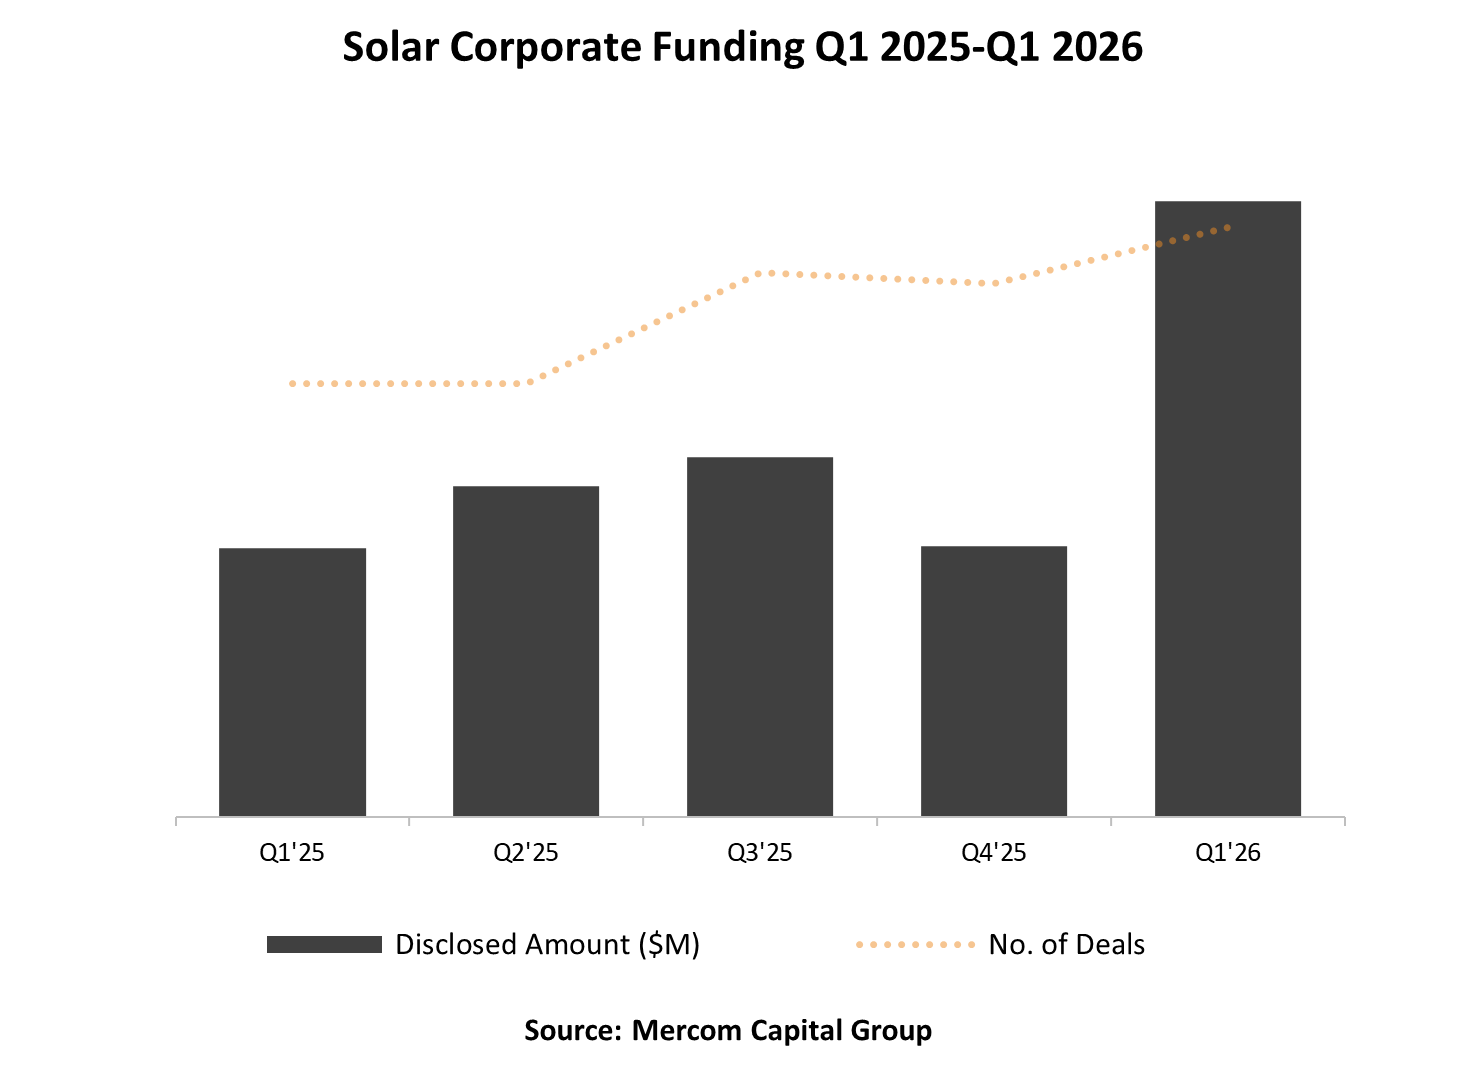
Corporate funding in the solar sector rose to $11.1 billion across 53 deals in the first quarter of 2026, marking a 131% year-over-year increase from the $4.8 billion raised across 39 deals in Q1 2025, according to Mercom Capital Group’s newly released Q1 2026 Solar Funding and M&A Report.
The funding also increased by 127% quarter-over-quarter from the $4.9 billion secured through 48 deals in Q4 2025. The report also showed that 18.4 GW of solar projects changed hands during the quarter.
Raj Prabhu, CEO at Mercom Capital Group, said, “Improved policy clarity and strong demand led to an increase in Solar funding and M&A activity in Q1 2026. Corporate funding was driven debt financing, which reached its highest level in over a decade, while solar project acquisitions were at their highest capacity since 2022. Investments remained focused on assets that can advance in the near term, as projects moved forward following earlier policy and financing uncertainty, and developers accelerated timelines ahead of tax credit milestones. M&A activity continued to reflect demand for pipeline and scale across the sector.”
Global venture capital (VC) funding in the solar sector totaled $1.1 billion across 17 deals in Q1 2026, down 21% from $1.4 billion across 14 deals in Q1 2025. However, on a quarterly basis, VC funding rose 74%, to $606 million raised across 20 deals in Q4 2025.
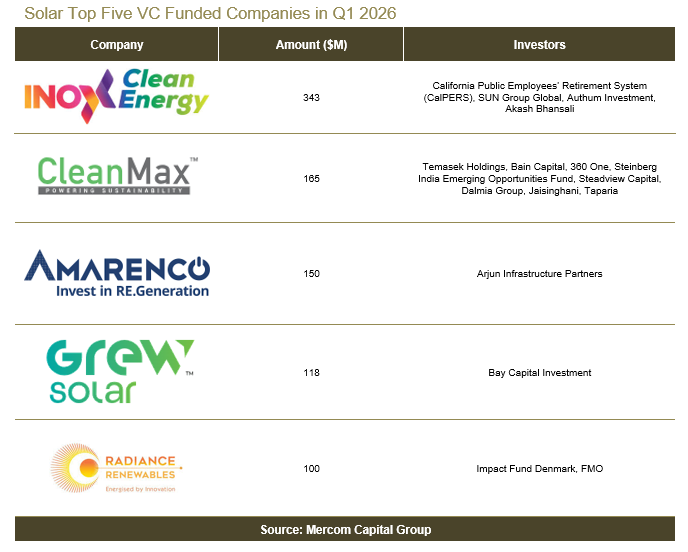
The largest VC- and private equity-backed companies during the quarter included Inox Clean Energy, which raised $343 million; Clean Max Enviro Energy Solutions, with $165 million; Amarenco, with $150 million; GREW Solar, with $118 million; and Radiance Renewables, with $100 million.
Of the total VC funding raised during the quarter, 51% went to solar downstream companies, which secured $543 million across 10 deals. In comparison, PV companies raised $423 million across four deals in Q4 2025, accounting for 70% of VC funding that quarter.
“The focus has shifted a long time ago from technology companies towards downstream, and that’s continuing,” Prabhu said.
Solar sector debt financing reached $8.9 billion across 28 deals in Q1 2026, up 154% from $3.5 billion raised in 23 deals during Q1 2025. Compared to Q4 2025, debt funding increased by 162%, with $3.4 billion raised across 20 deals. Public market financing totaled $1.1 billion across eight deals in Q1 2026, compared to only $20 million raised in two deals during the same period last year.
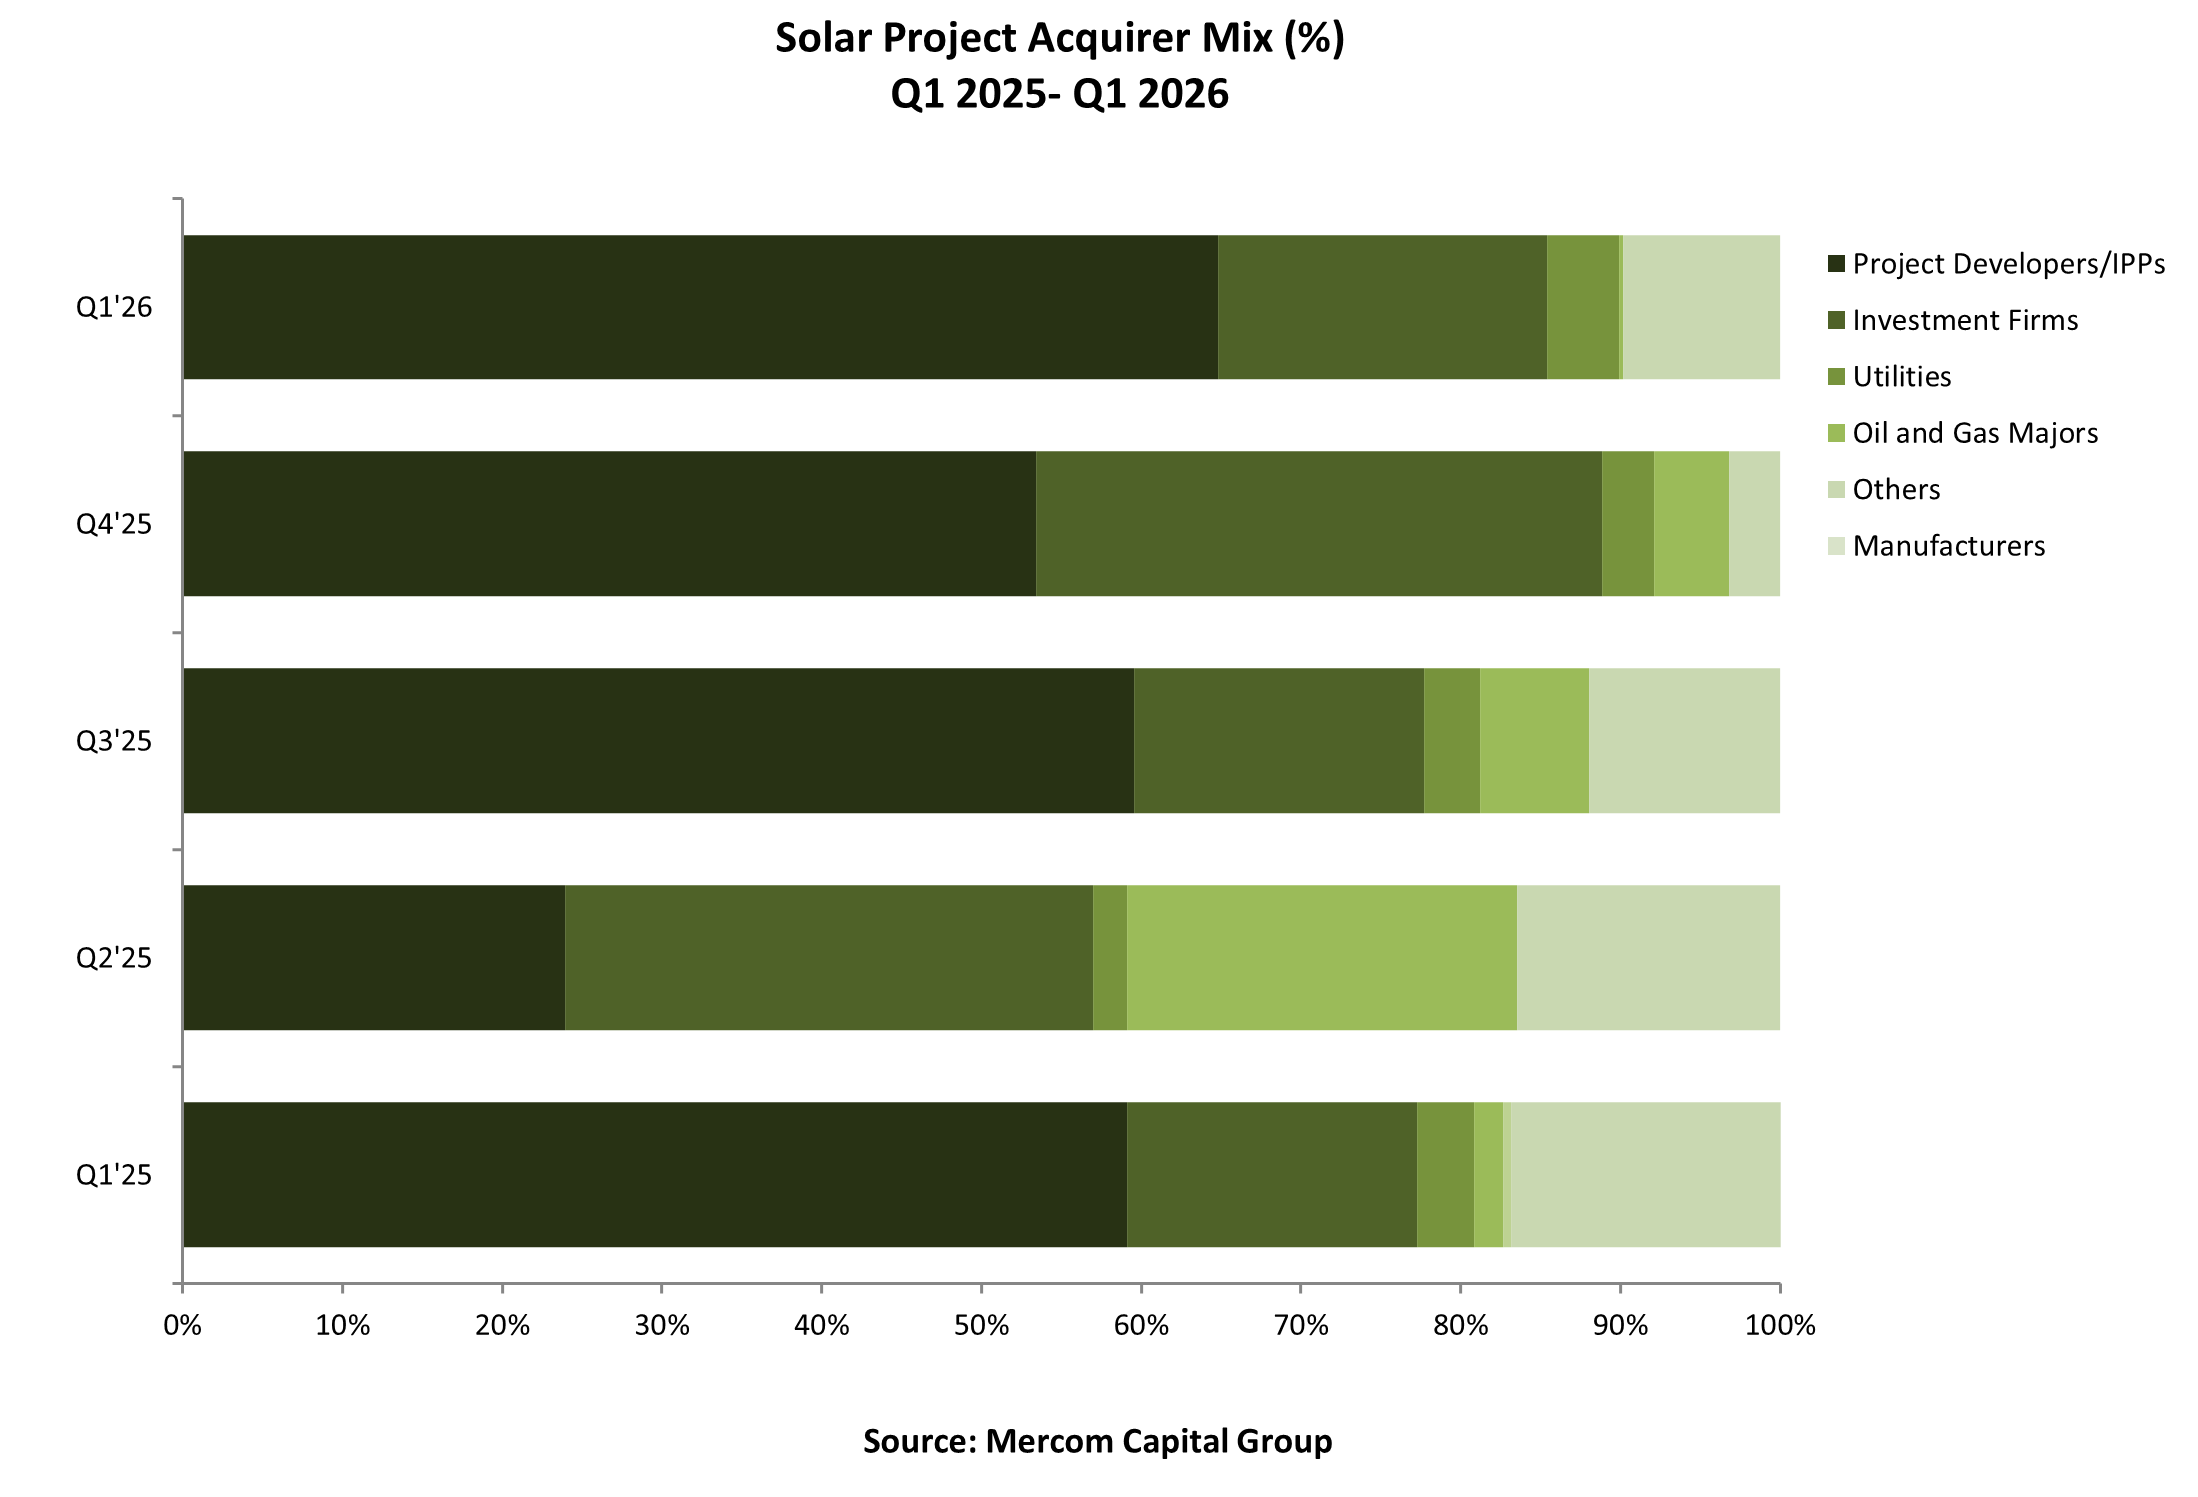
Investment firms and infrastructure funds acquired 3.8 GW, while other buyers, including industrial conglomerates, energy companies, engineering firms, and IT companies, acquired 1.8 GW. Utility companies acquired 830 MW of projects, oil and gas firms acquired 40 MW, and manufacturing companies acquired 20 MW.
Prabhu stated that geopolitical tensions and the war in Iran were affecting the supply chains across parts of Asia, including India. He added that the disruptions had also increased awareness around energy independence, strengthening long-term demand for renewable energy, energy storage, and electric vehicles.
This 62-page report covers 448 companies and investors and contains 56 charts, graphs, and tables.
To learn more about Mercom’s Q1 2026 Solar Funding and M&A Report, visit: https://mercomcapital.com/product/q1-2026-solar-funding-ma-report/


Meghana Prasad
More articles from Meghana Prasad.
